
Portfolio Visualizer: Best Alternatives for Investment Analysis

If you’re serious about optimizing your investment portfolio, a robust analytics platform is a must. “Portfolio Visualizer” has long been a popular choice among traders and investors - but what if you’re looking for something that offers more? This post will cover why analytics are crucial for any investor, what you should expect from your analytics tool, and how FIREkit can serve as an all-in-one alternative (complete with powerful visualizations, real-time benchmarks, and automated insights).
Why Investment Analytics Is Important
- Informed Decision-Making
Without accurate, up-to-date analysis, you’re essentially investing in the dark. Analytics illuminate your portfolio’s performance drivers, highlighting both strengths and weaknesses. - Risk Management
A good analytics platform helps you identify where your portfolio is most exposed, whether that’s a single sector, asset class, or region. By pinpointing these risks, you can rebalance appropriately. - Goal Tracking
Whether you aim for early retirement, saving for a major purchase, or simply growing your wealth, analytics help measure your progress. You can see if your current allocation is aligned with your long-term goals.
FIREkit Analytics: A Comprehensive Alternative to Portfolio Visualizer
Below are the key advantages Firekit offers for deeper investment insights, referencing the intuitive visuals and tools in our user-friendly dashboard. From interactive heatmaps to automated rebalancing tips, every feature is designed to help you optimize your portfolio and stay aligned with your financial goals.
1. Capitalization & Benchmark
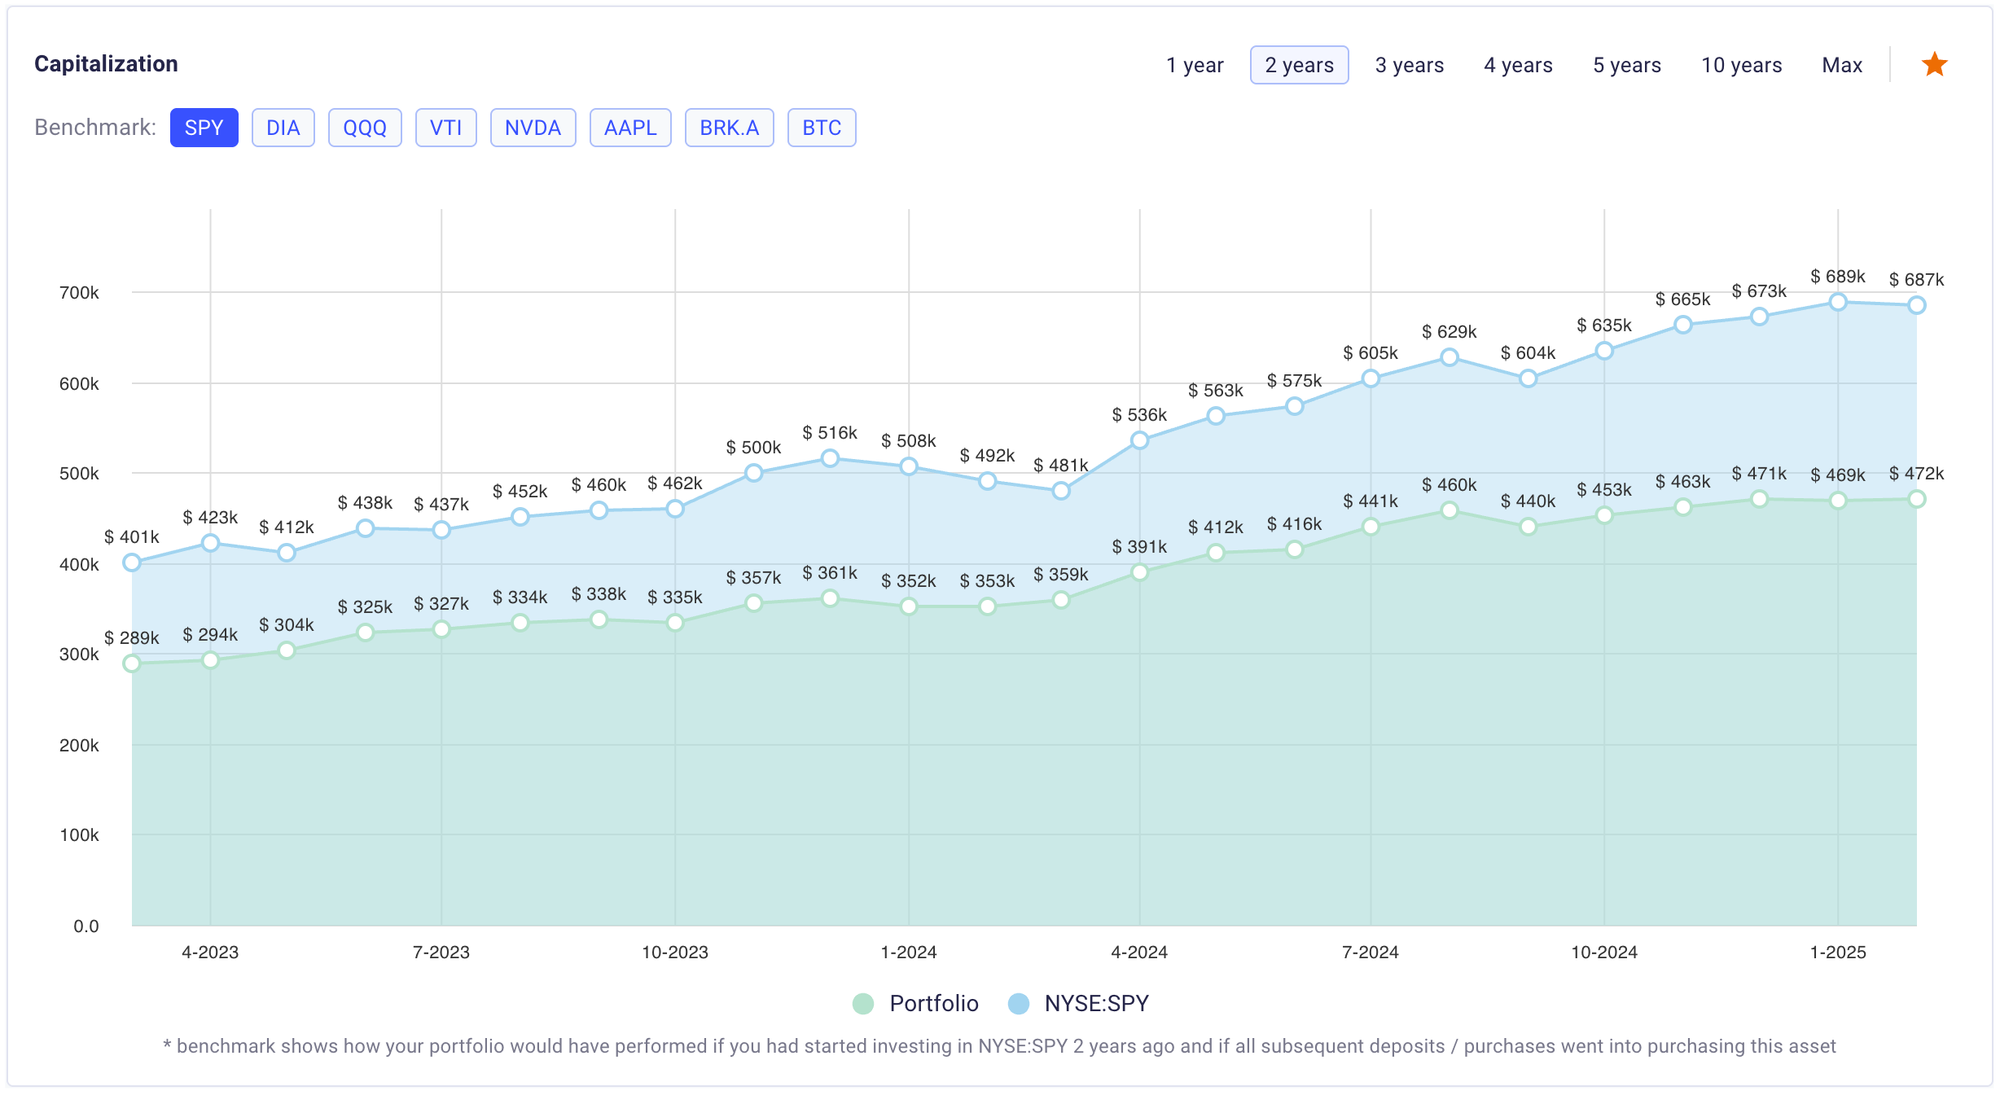
One of the most critical features of an analytics platform is showing how your portfolio has grown over time. Historical charts can display your total capitalization and track how deposits, market performance, and dividends contributed to overall growth. You can also see how your performance stacks up against benchmarks like SPY, QQQ, or any other.
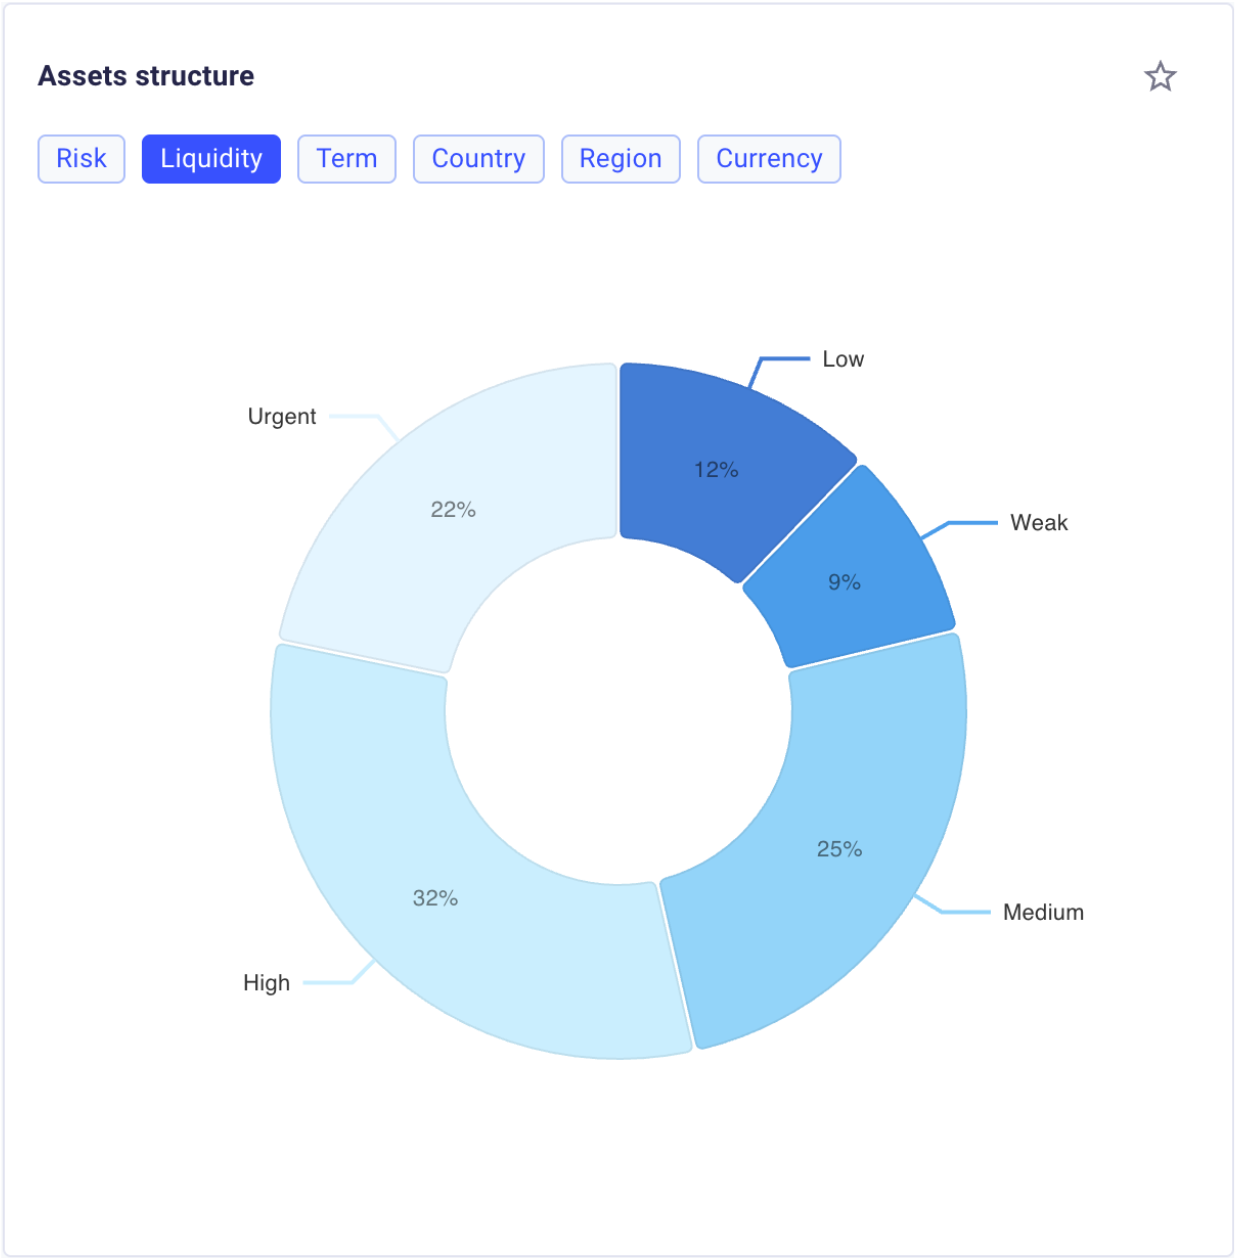
2. Dynamics of Asset Proportions
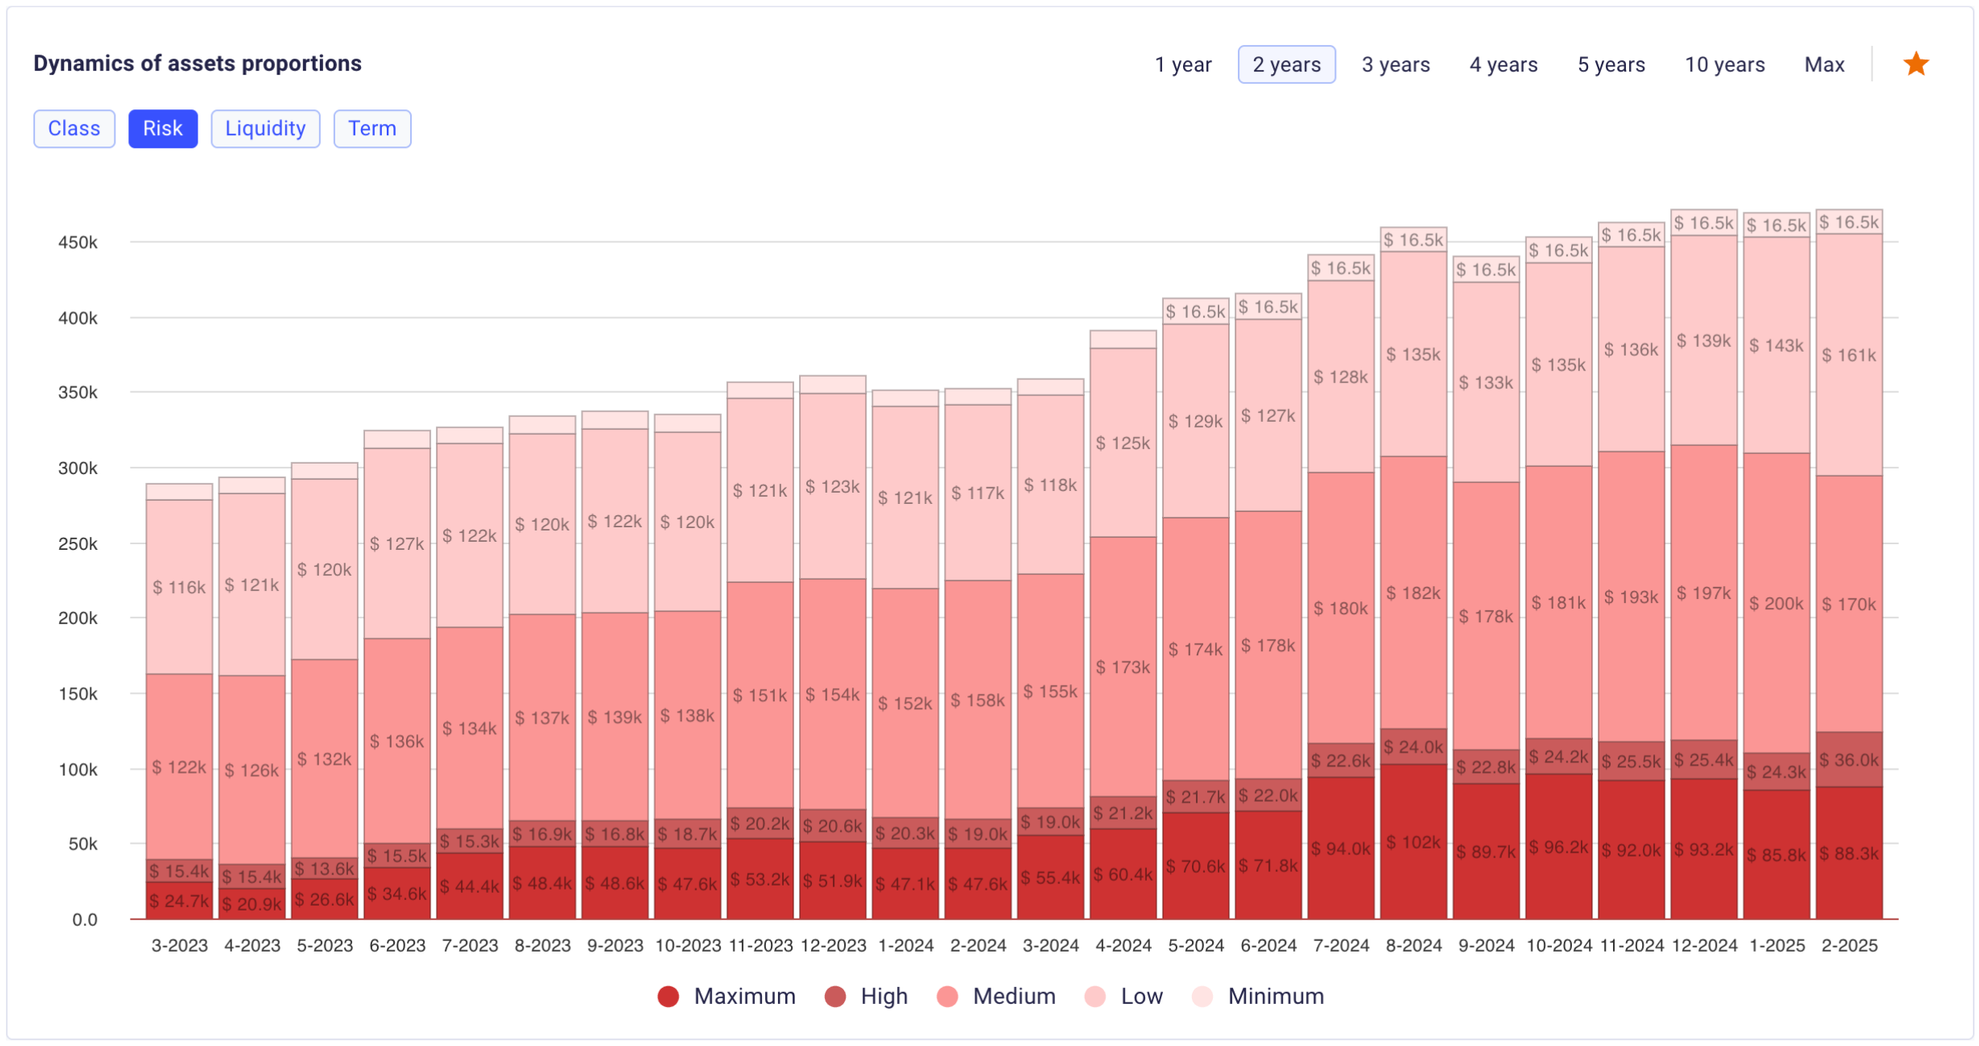
Staying on track with your investment goals often requires knowing how your portfolio evolves across different dimensions—whether it’s Risk, Class, Liquidity, or Term. Viewing these proportions month by month helps you spot shifts early on, see if you’re overexposed to a particular category, and make timely rebalancing decisions to keep your portfolio aligned with your strategy.
3. Portfolio Heatmap
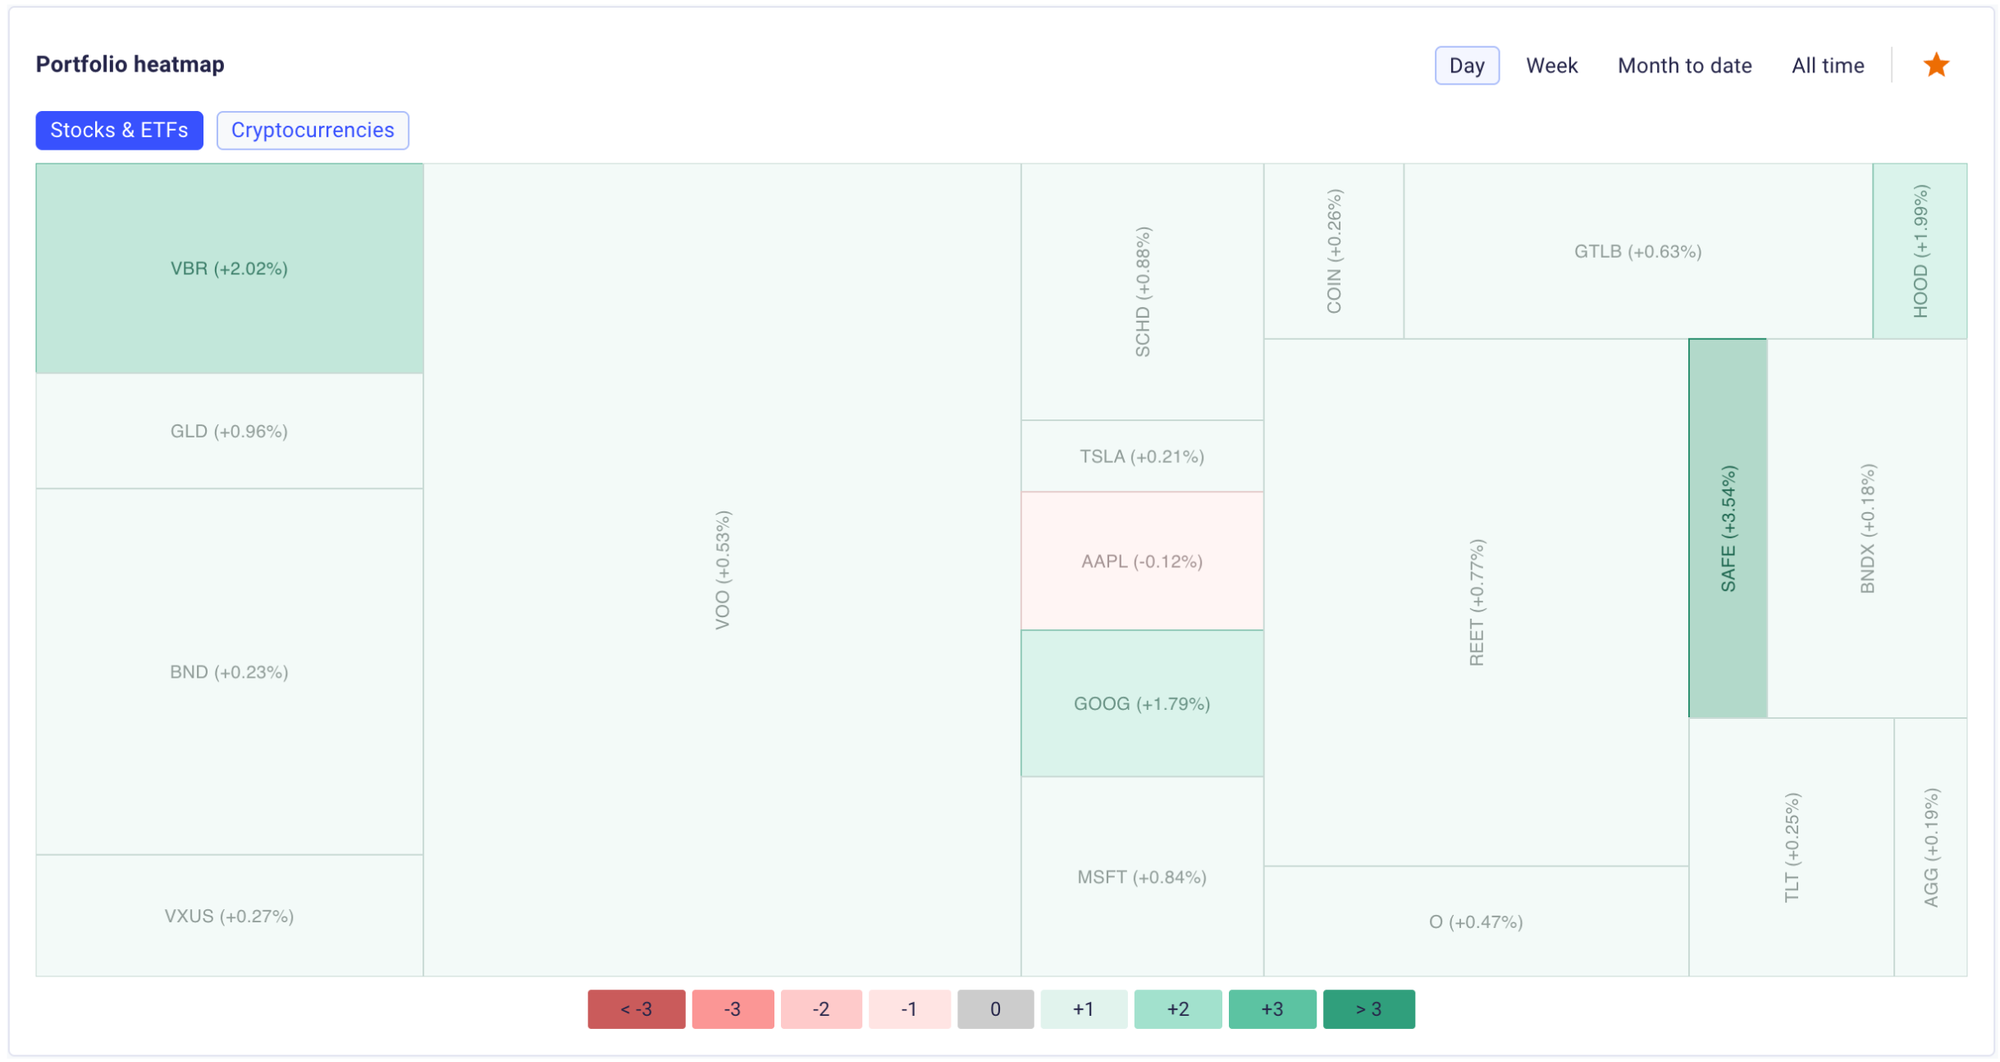
The heatmap offers a quick way to assess how your investments (both Stocks and Cryptocurrencies) are performing. You can switch between these categories and choose different time frames (Day, Week, Month to Date, All Time) to see which assets are up or down. The size of each rectangle indicates its weight in your portfolio, while the color scale (red to green) shows percentage changes. This flexible view helps you spot top performers and underperformers at a glance, guiding more informed decisions on when to hold, sell, or rebalance.
4. Dividends History
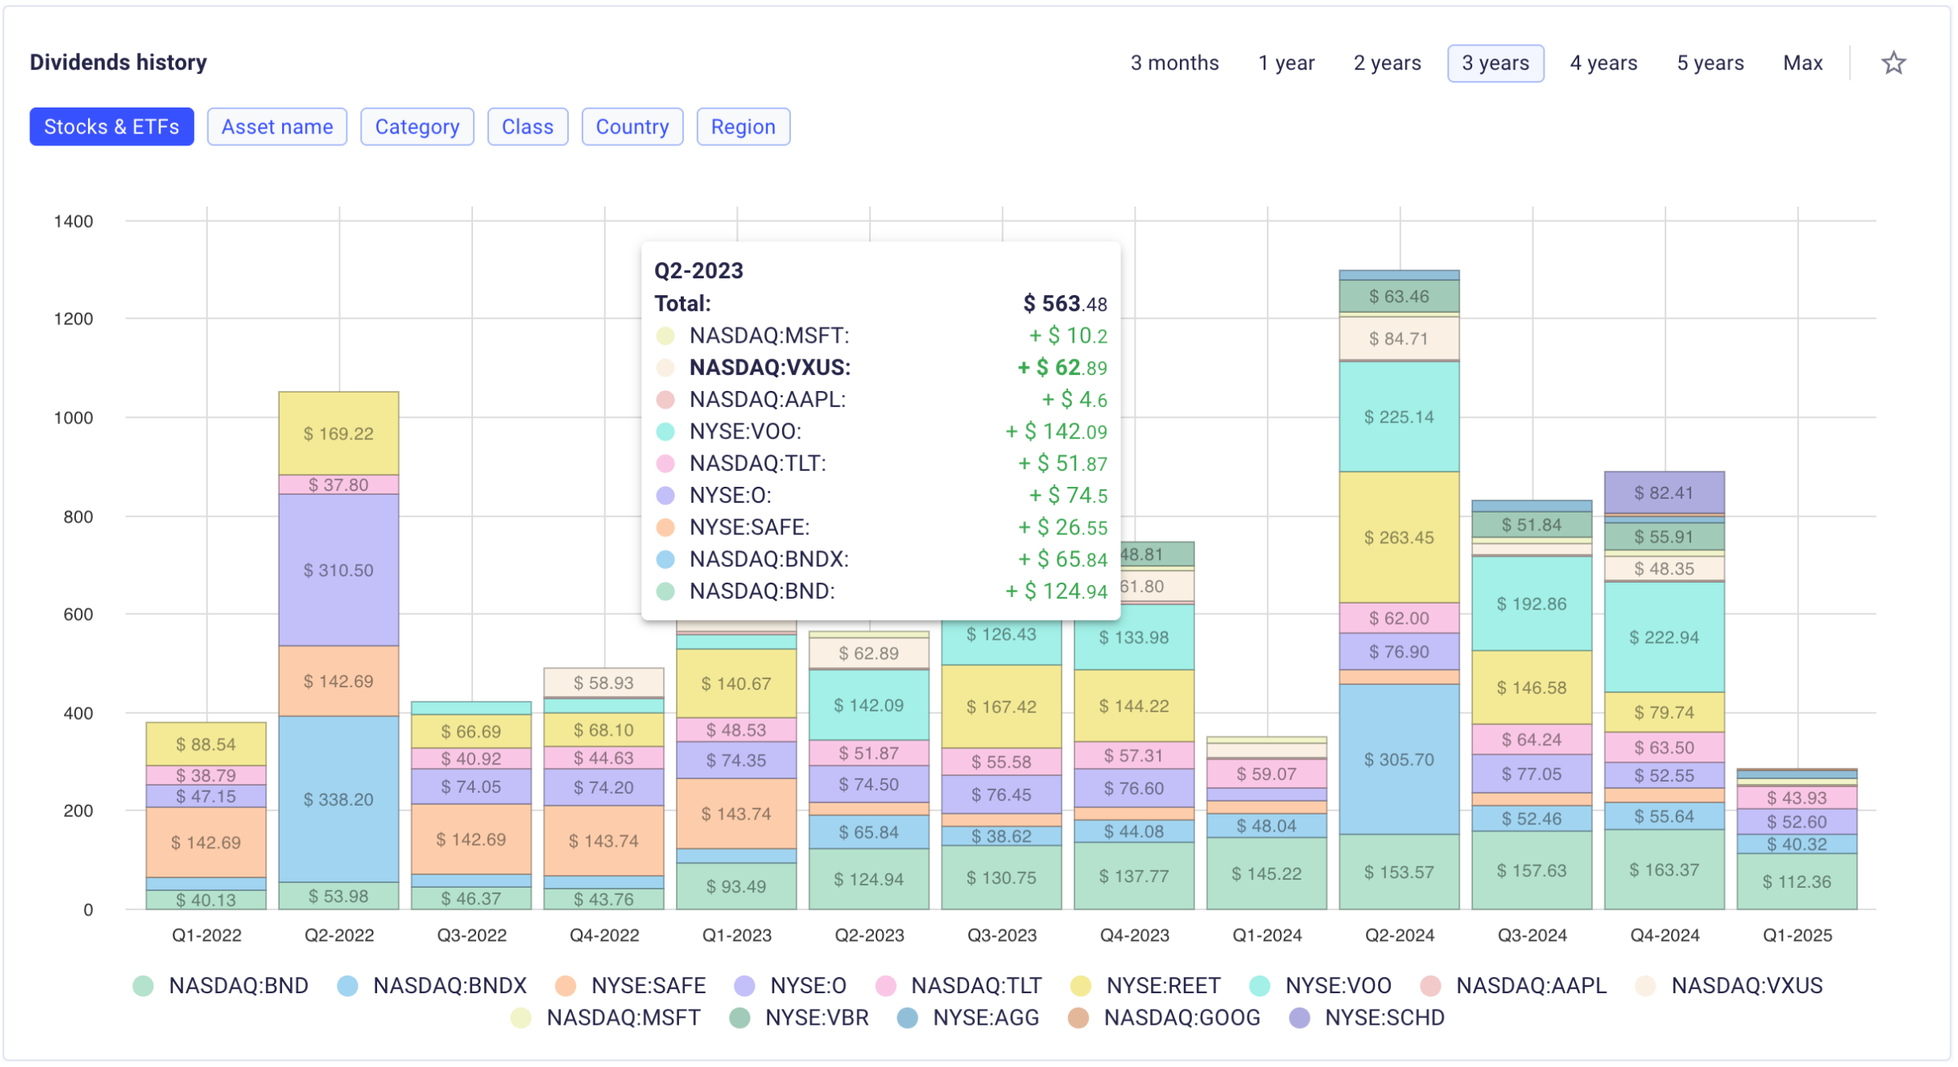
Monitoring dividends across various periods can reveal crucial trends in your passive income strategy. By grouping payouts according to asset type, risk level, or even geographic region, you gain a clearer picture of which holdings are consistently boosting your returns and which ones may be lagging. This insight helps you identify stable, high-yield performers worth reinvesting in, as well as underperformers that might need adjusting or replacing.
5. Dividend Growth Projection
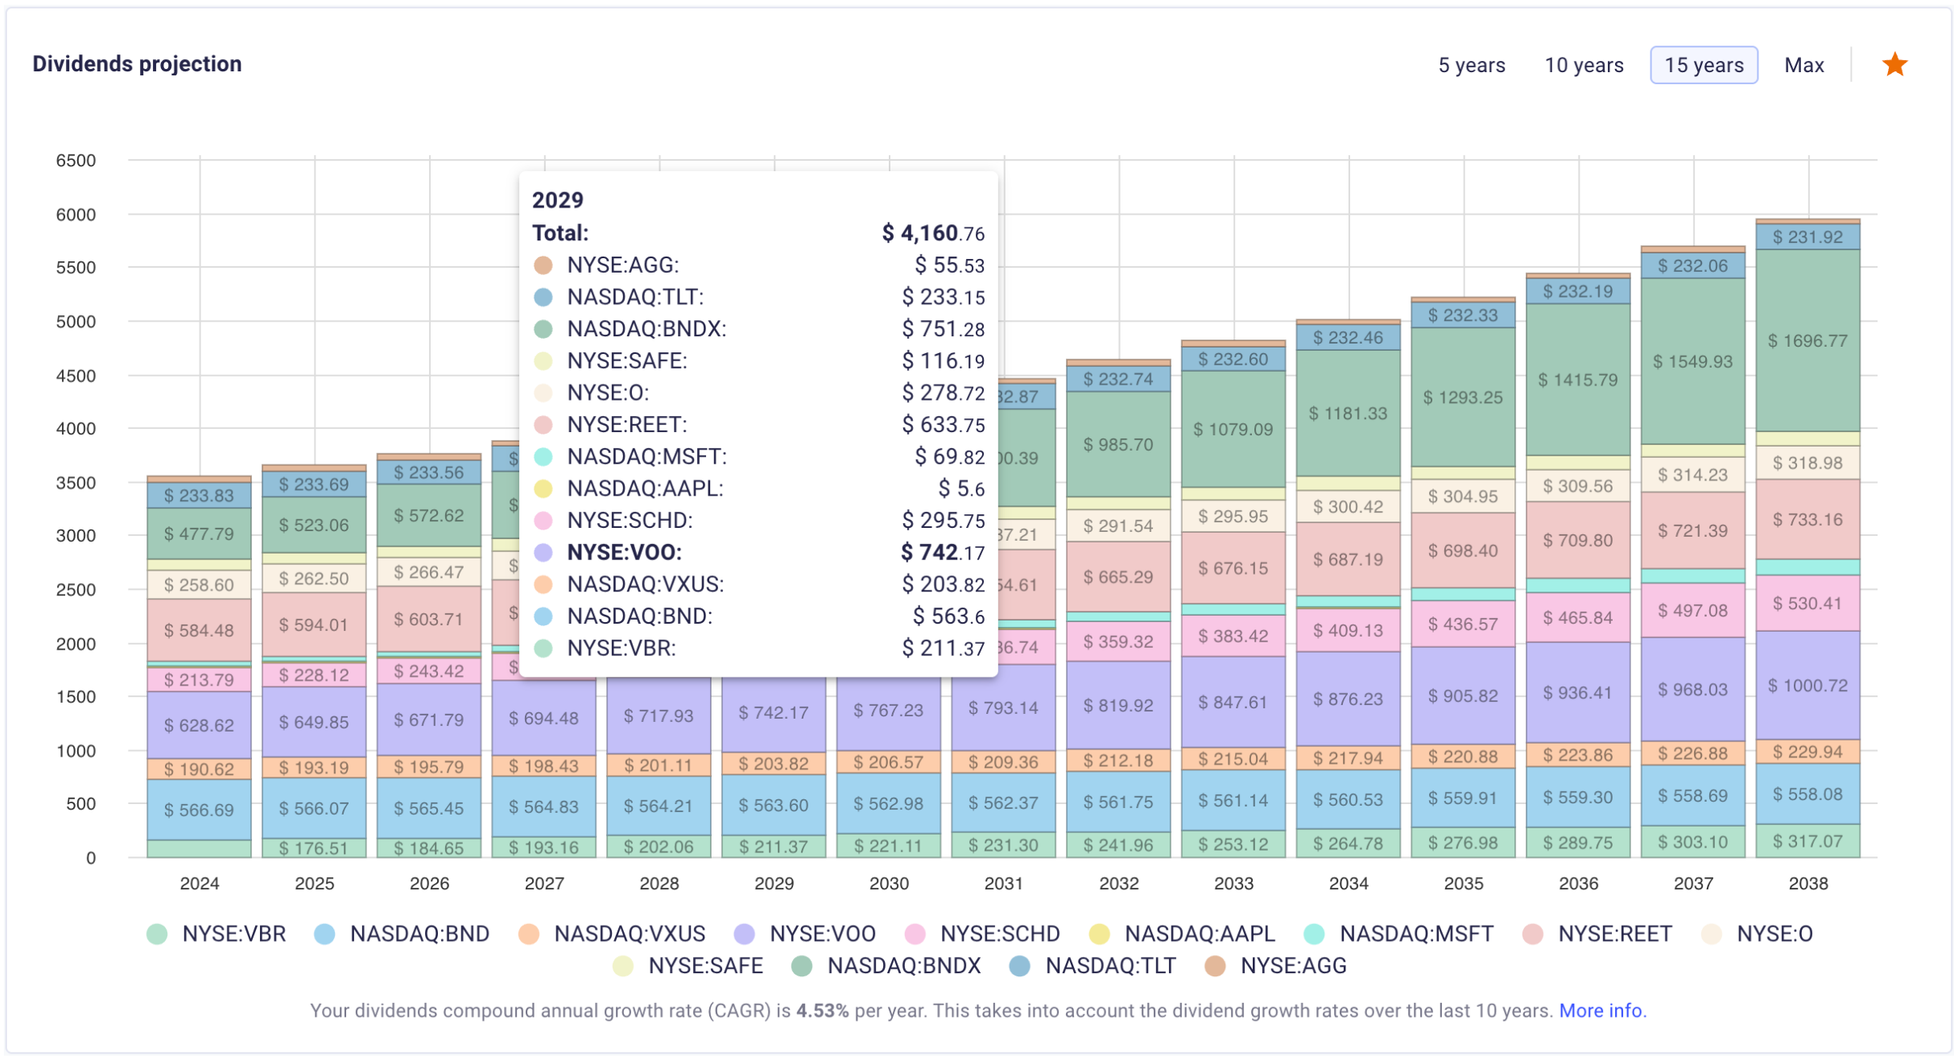
Forecasting future dividend payouts is a key step in building a reliable passive income strategy. By projecting dividend growth rates over multiple years, investors can estimate their potential annual income and see how compounding might accelerate returns. Analyzing expected payouts from each holding also clarifies which assets could become long-term income powerhouses and which ones may warrant reconsideration. This forward-looking perspective aids in planning for major financial milestones, reassessing risk levels, and ultimately optimizing the overall portfolio for steady, compounding dividends.
6. Assets Map
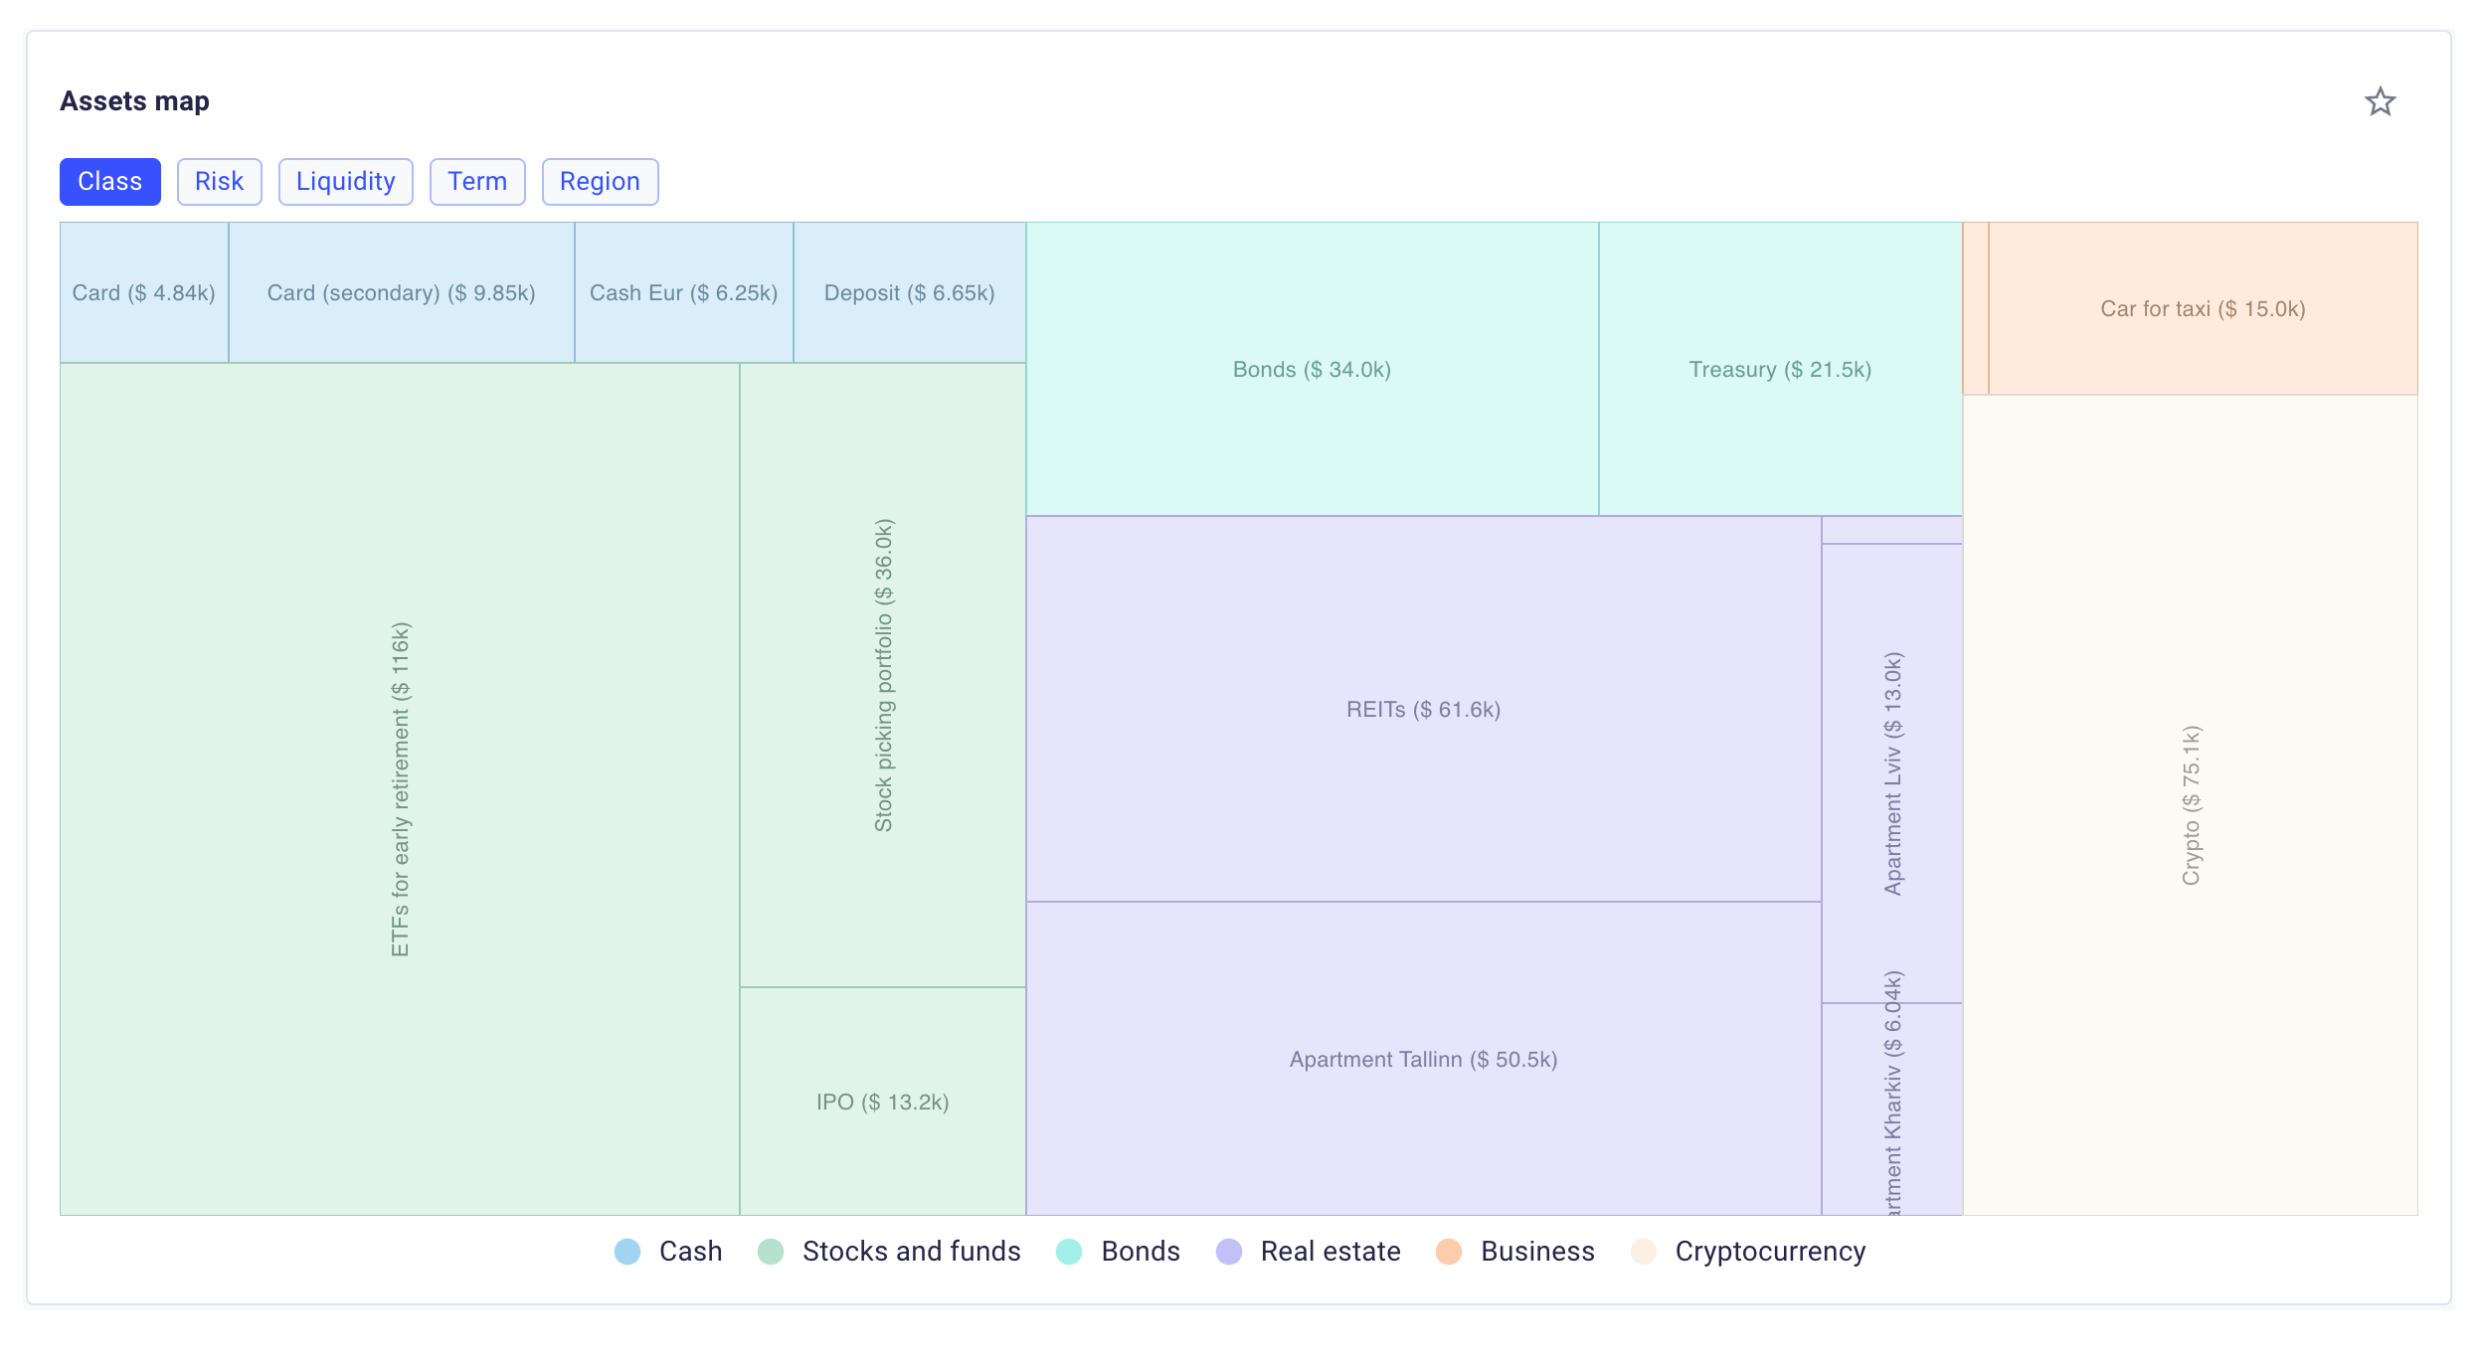
Viewing the overall composition of your holdings in a Treemap layout makes it easier to identify which assets carry the most weight. Each segment’s size reflects its share of the total portfolio, allowing you to quickly spot any overconcentration in a specific class, risk level, or region. This holistic perspective helps determine if you should rebalance or further diversify, keeping your investments aligned with your long-term strategy.
7. Scorecard
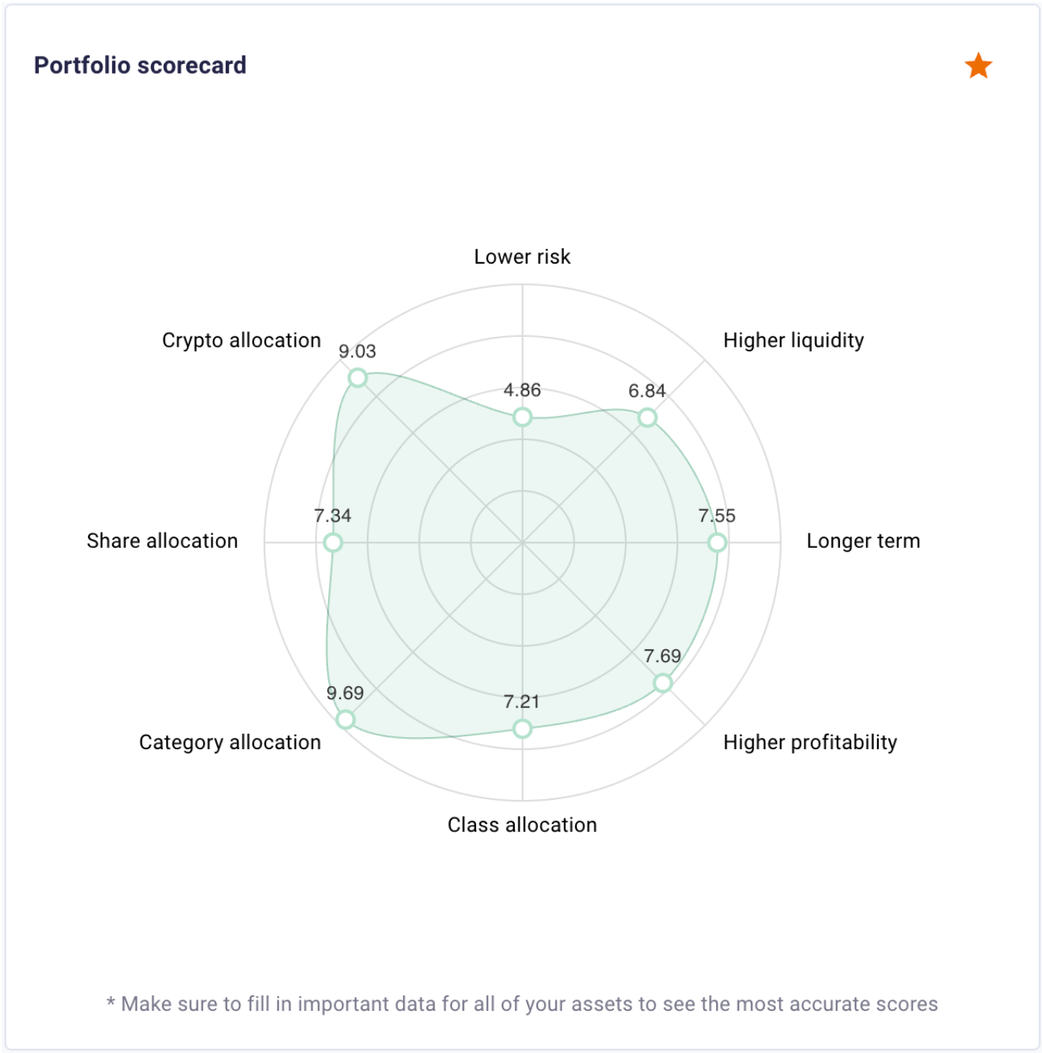
Evaluating your holdings across multiple dimensions (such as risk, liquidity, allocation, profitability, and time horizon) helps pinpoint where you might be overexposed or under-diversified. A radar-style scorecard offers a clear visual snapshot of these strengths and weaknesses, guiding you toward adjustments in areas like crypto allocation, share weighting, or overall risk level. By regularly reviewing this overview, you can maintain a more balanced and resilient portfolio aligned with your long-term financial goals.
8. Asset Allocation & Rebalance
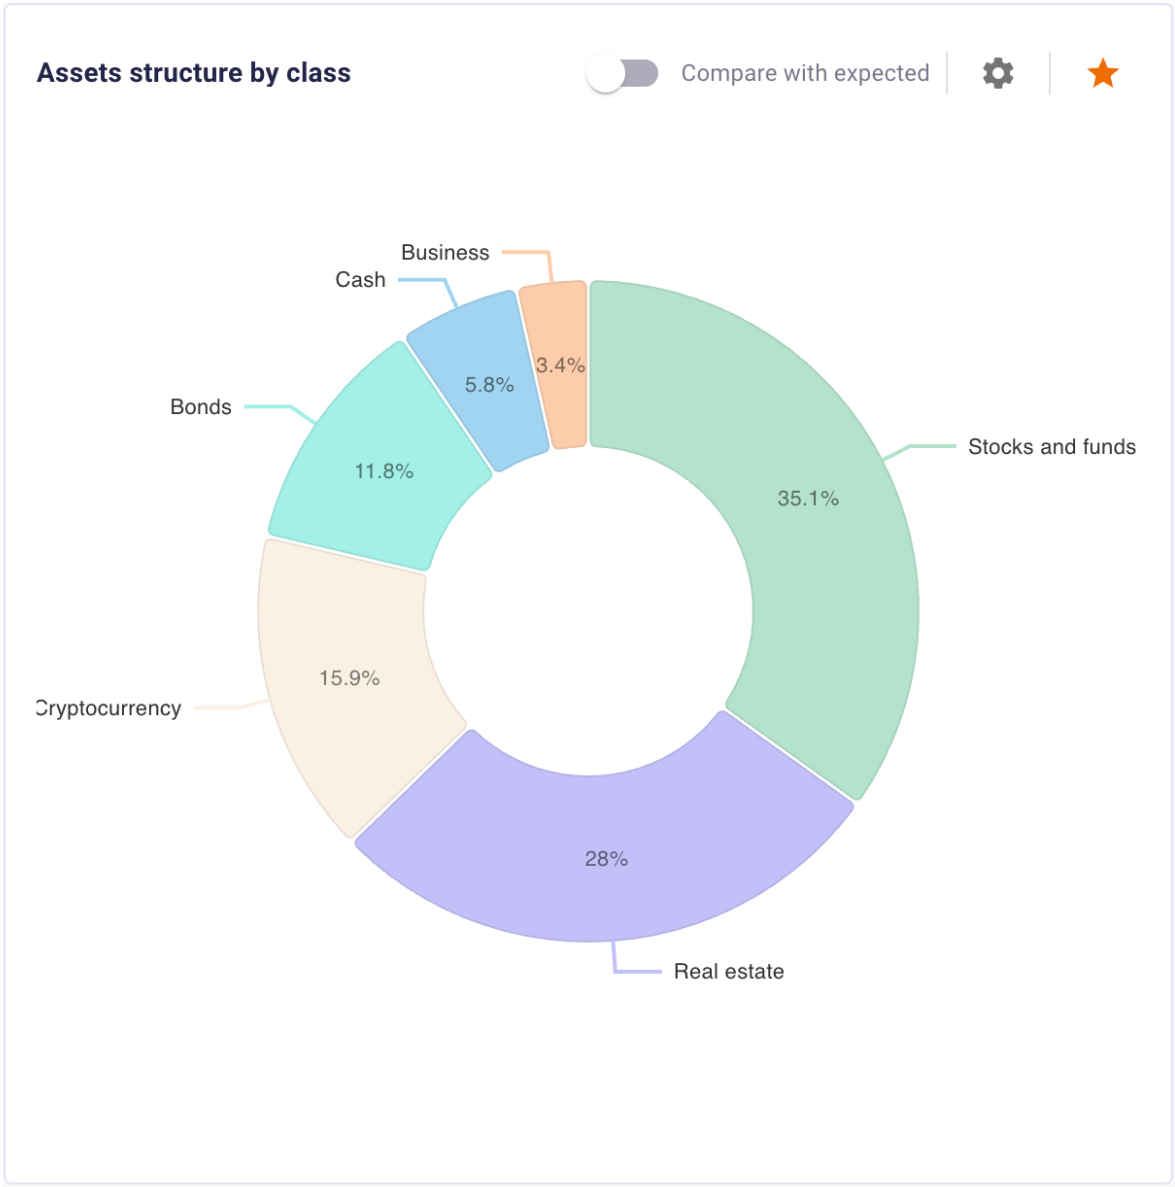
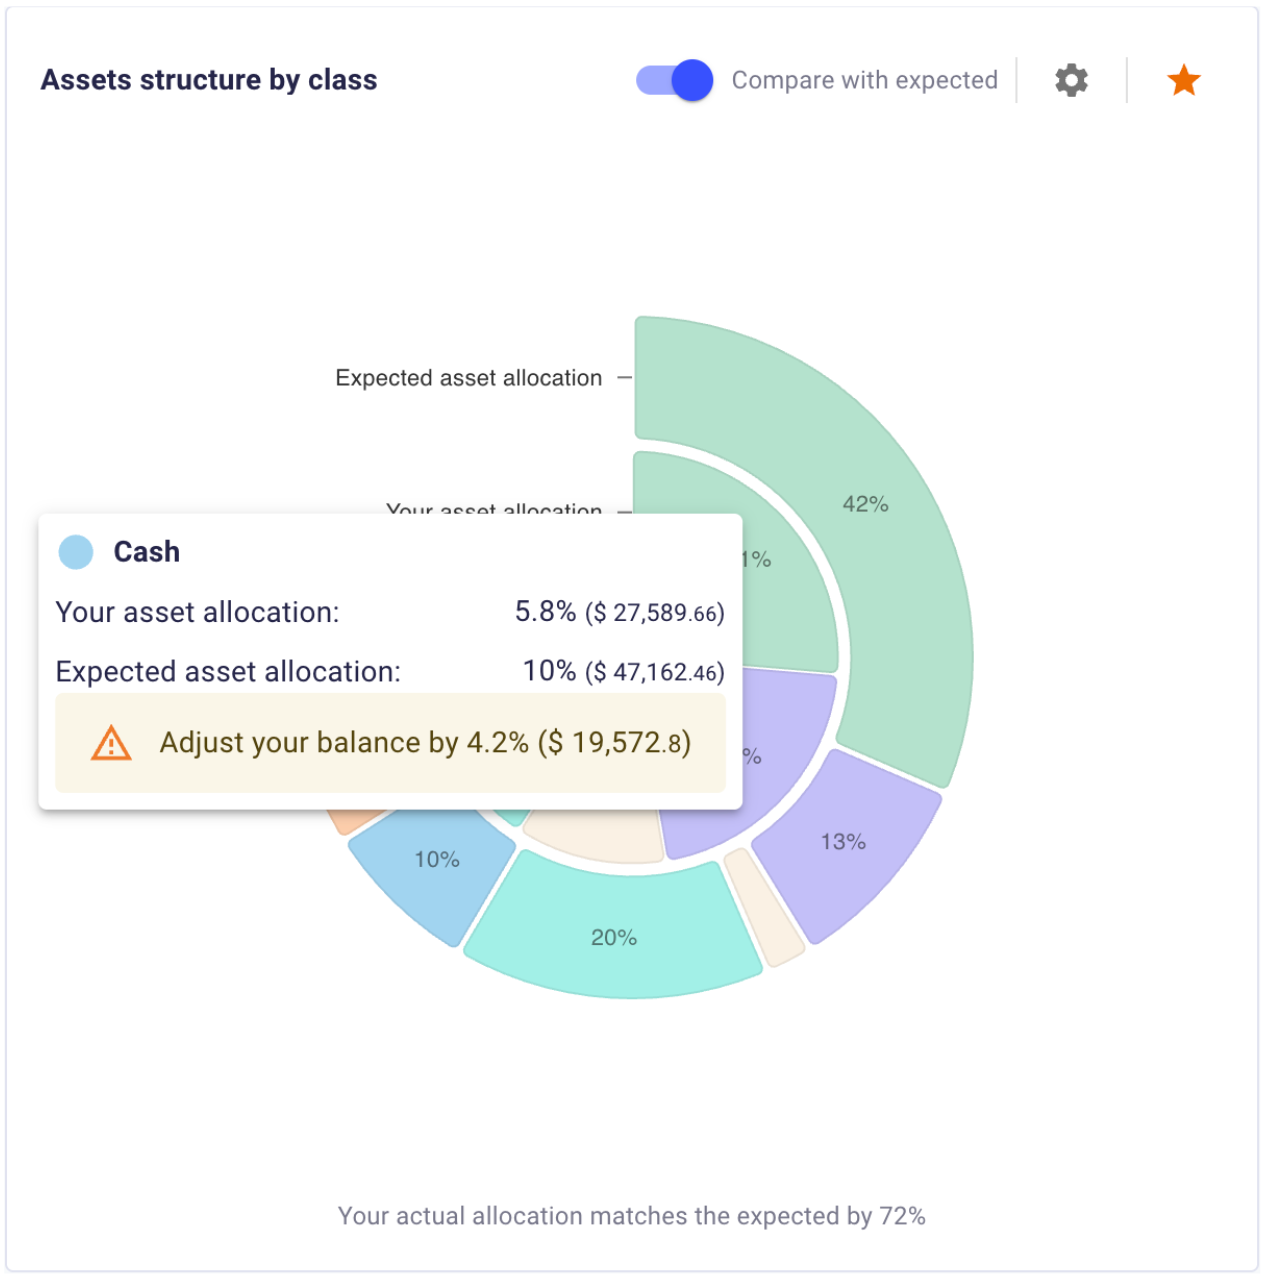
FIREkit Asset Allocation & Rebalance Charts
Adjusting and rebalancing your portfolio becomes far simpler when you can view how each asset is distributed across categories like Risk, Liquidity, Term, Region, or Currency. Comparing the actual allocation to a target “expected” distribution shows if you’re overweight or underweight in certain areas—such as holding too few bonds or too much crypto. This clear snapshot of mismatches highlights exactly where and how to redirect funds, helping you maintain a balanced portfolio aligned with your long-term investment strategy.
Conclusion
Investment analytics is more than just pretty charts, it’s about having actionable insights that improve your decision-making, tighten your risk management, and keep your goals in focus. While Portfolio Visualizer is well-known, FIREkit offers a fresh, comprehensive approach:
- In-depth Historical Analysis & Benchmarks
- Allocation Dynamics & Heatmaps
- Dividend Tracking & Projections
- Asset Maps & Radar-Style Scorecards
- Automated Rebalancing Alerts
Curious to dive in and explore? Check out our live demo and experience the full power of interactive portfolio analytics!